Cartilage and Meniscus Imaging
The MRI lab applies quantitative MRI (qMRI) as a biomarker to evaluate articular cartilage degeneration using T2 and T1ρ mapping. We also use qMRI to characterize meniscal tears and healing using ultra-short echo (UTE) imaging and derived T2* maps. Current projects in this area include:
- MRI-compatible loading device to evaluate changes of cartilage T1ρ values and cartilage thickness in patients undergoing partial meniscectomy
- T2* relaxometry of the ACL in pre- and post-menopausal females
- T2* relaxometry status post anterior cruciate ligament (ACL) reconstruction
- T2* mapping of the meniscus in collegiate athletes
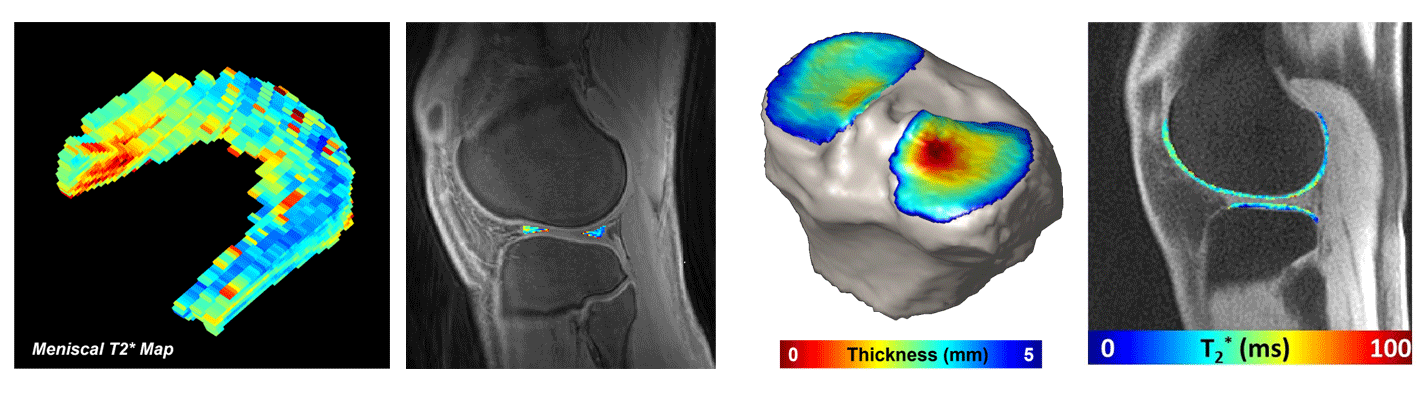
Quantitative imaging permits visualization of musculoskeletal tissues and provides information about their biochemical composition and organization. Left to Right: 3D meniscal T2* map, T2* map of the lateral meniscus, cartilage thickness and, T2* of the lateral femoral condyle and the lateral tibial plateau.
Imaging tissues around orthopedic hardware
Performing MRI near metal is challenging due to the presence of susceptibility artifacts that cause image distortion and signal loss. The MRI lab has helped develop and continues to optimize the multi-acquisition variable resonance image combination (MAVRIC) pulse sequence to assess bone-implant integration and biologic reactions in joint arthroplasty and other orthopedic hardware.
Research areas include:
- Longitudinal assessment of total hip arthroplasty (THA) integration using MAVRIC-based morphologic and quantitative MRI techniques
- Diffusion-weighted imaging (DWI) to map microstructural changes and evaluate synovial reactions following THA
- Evaluating MAVRIC-based T2 mapping of infrapatellar fat-pad in patients with total knee arthroplasty (TKA)
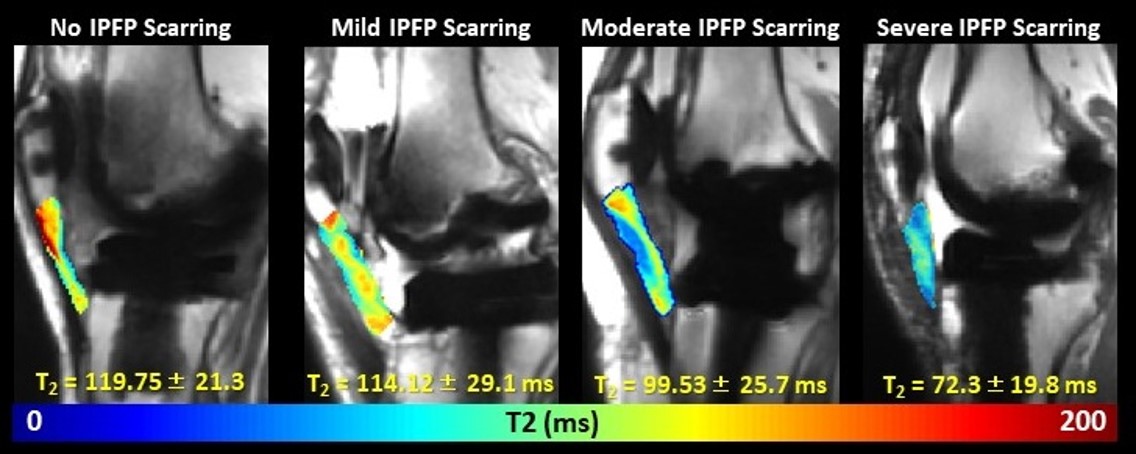
T2 mapping of the infrapatellar fat pad (IPFP) in patients with total knee arthroplasty displays shortening of T2 that is associated with an increase of IPFP scarring.
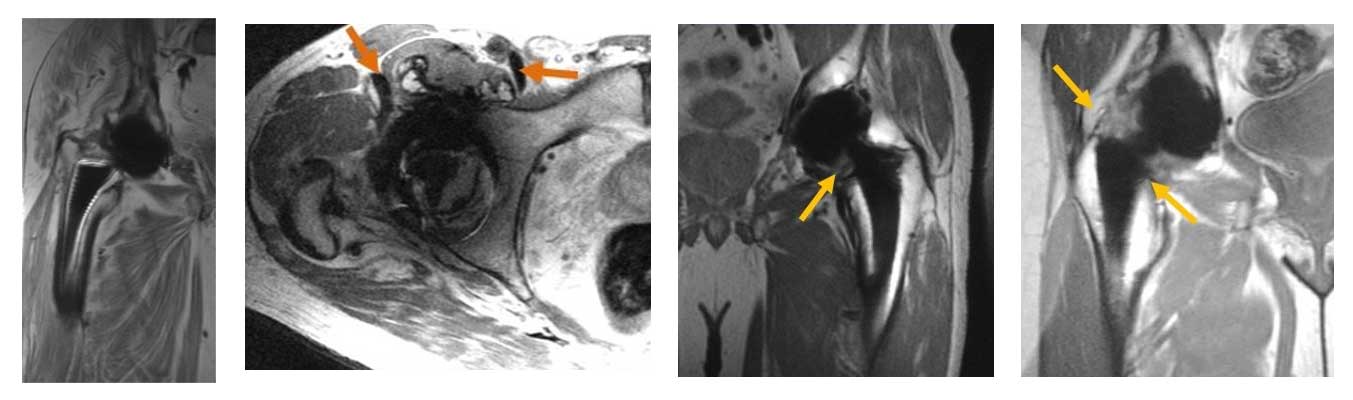
Advanced 3D multispectral imaging techniques permit visualization of soft tissues near total hip replacements. Left to Right: Image displays loosening of the femoral stem (bright lines around stem), metallic debris from implant wear (arrows), synovial response due to polymeric (plastic) wear debris from the implant (arrow), and an adverse local tissue reaction (arrows)
Bone MRI with Zero Echo Time (ZTE)
Unlike conventional MRI acquisitions, ZTE MRI facilitates visualization of bone with tissue contrast similar to computed tomography (CT). The MRI lab is investigating ZTE applications for a wide range of orthopedic conditions.
Research areas include:
- ZTE-based in silico collision modelling of hip morphology and range-of-motion in femoroacetabular impingement (FAI)
- ZTE-based bone modelling for 3D morphologic assessment and 3D-printed surgical guides
- Clinical applications of ZTE imaging in trauma and surgical planning
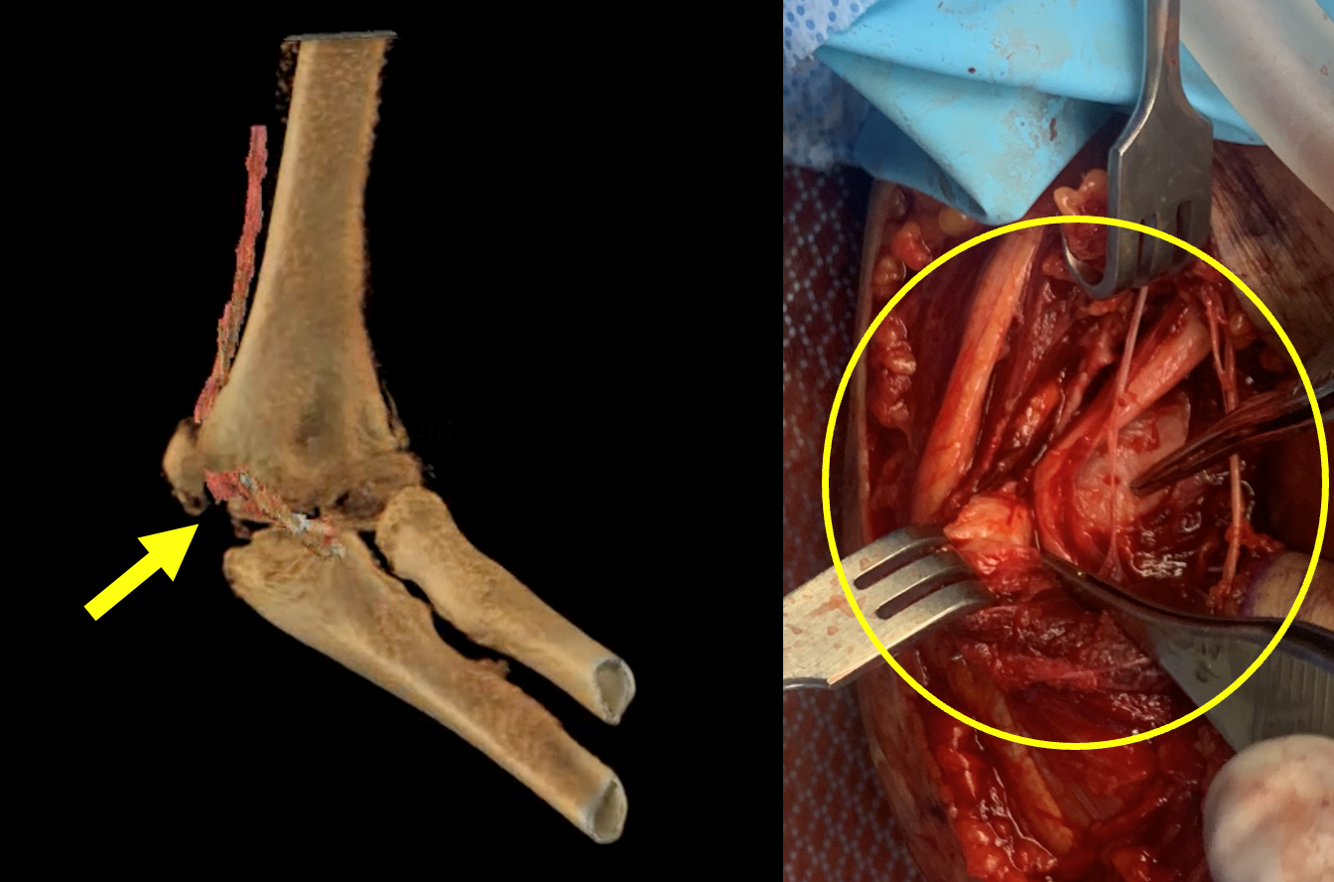
Median Nerve Entrapment at Medial Epicondylar Fracture Site of Elbow. Intraoperative photo courtesy of Peter Fabricant, MD
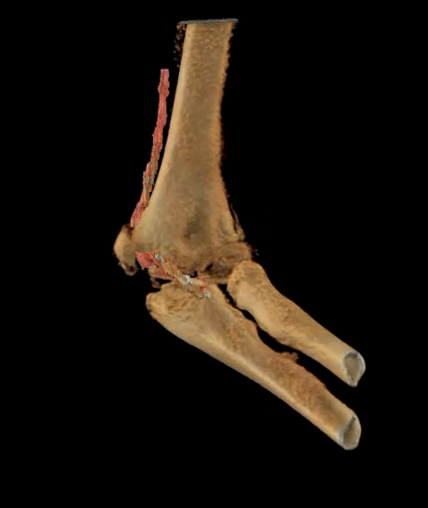
3D visualization of bone (beige) and entrapped medium nerve (red) at the epicondylar fracture site of the elbow.
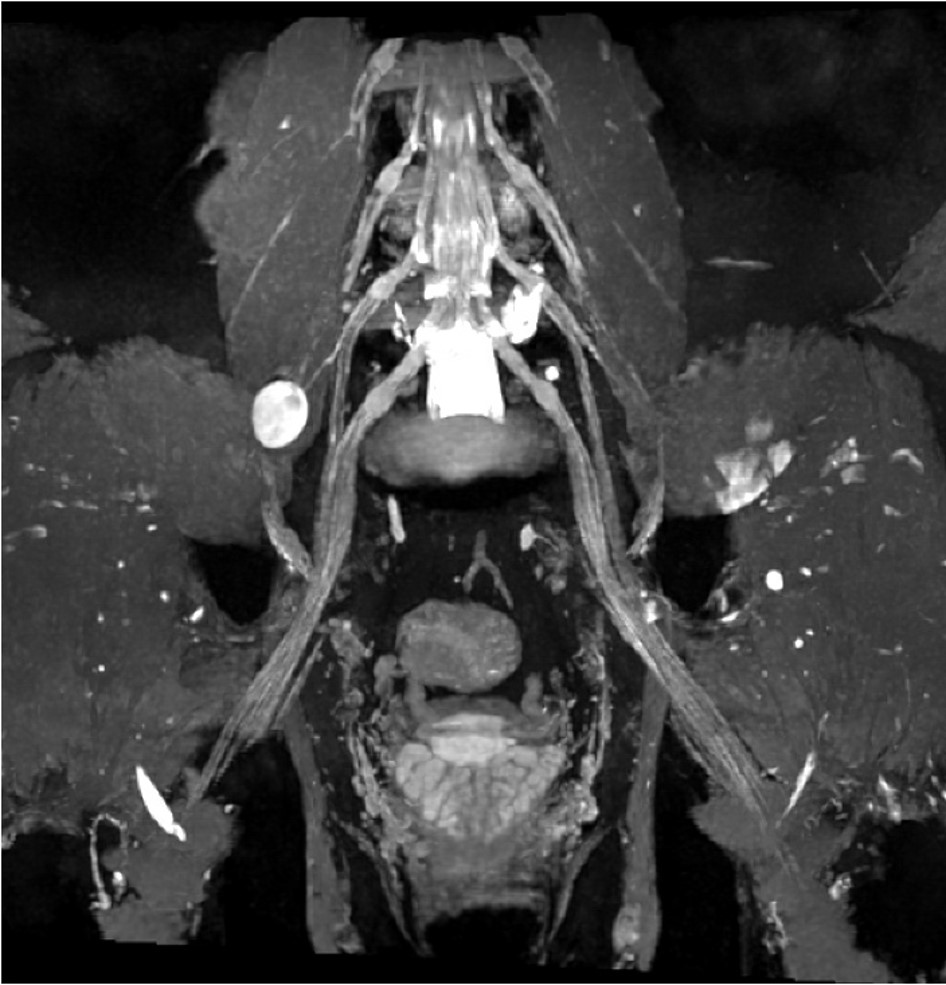
3D MR Neurography (MRN): Peripheral Neve Sheath Tumor Arising from Right Femoral Nerve of Lumbosacral Plexus (Pelvis)
Magnetic Resonance Neurography (MRN)
MRN uses high-resolution magnetic resonance imaging (MRI) to depict and interrogate peripheral nerves that are difficult to capture with conventional MRI. Characterization of peripheral nerve injury aids in the diagnosis and management of traumatic and atraumatic conditions.
Research areas include:
- High-resolution, vascular suppression techniques for peripheral nerve visualization
- Imaging biomarkers of Parsonage-Turner syndrome (neuralgic amyotrophy)
- Quantitative techniques, including diffusion MRI, to measure the degree of nerve and muscle injury
- MRI coil development for spine and peripheral nerve imaging
- MRI nerve atlas development
- Novel use of iron agent (ferumoxytol) for vascular suppression
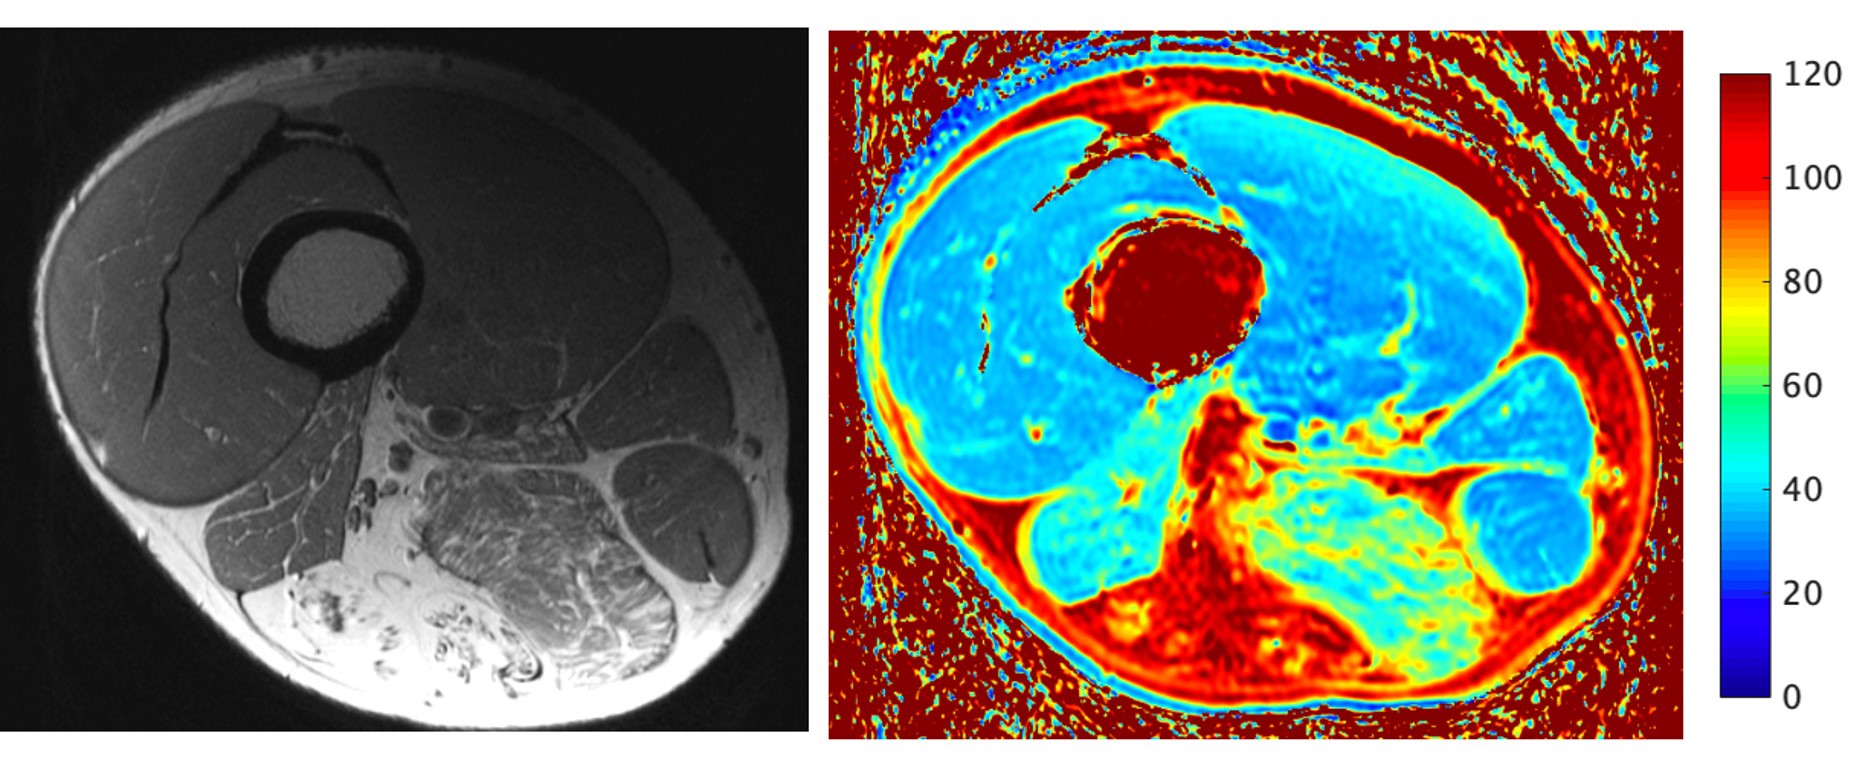
Quantitative T2 mapping of denervated, fatty-infiltrated muscle in the thigh from sciatic neuropathy. Anatomical image (left, proton density), and T2 map (right, in milliseconds)